Rical 1876: Putting Late Ottoman Statesmen in Context
An interactive timeline of the late Ottoman and early Republican statesmen, drawn as a storyline: one line per person, one box per event, so you can see who was who and what they did together.
I made a small app called Rical 1876. It is a timeline of the late Ottoman and early Republican statesmen (the ricâl-i devlet), from the Young Ottomans to the first years of the Republic. Each person is a vertical line and time flows down. When people take part in the same event, their lines meet in a box, each sitting with the side they were on. A line ends where the person dies.
The code is on GitHub: CahidArda/rical-1876.
Where it came from
I was in Macedonia recently and spent the trip reading about the events of the early 20th century: Resen, Manastır, 1908. Somewhere along the way the Çerkes Hasan incident came up, and I wondered who he had shot and why.
We hear these names all through history class: Midhat Paşa, Enver, Talât, Niyazi, Mahmud Şevket Paşa. But since we didn’t live back then, they feel like characters who appear out of nowhere, do one thing and leave. Who were they really, once you put them in context? Who stood next to whom, and who turned on whom later? This timeline is an attempt at that: the statesmen of the period, placed in relation to each other.
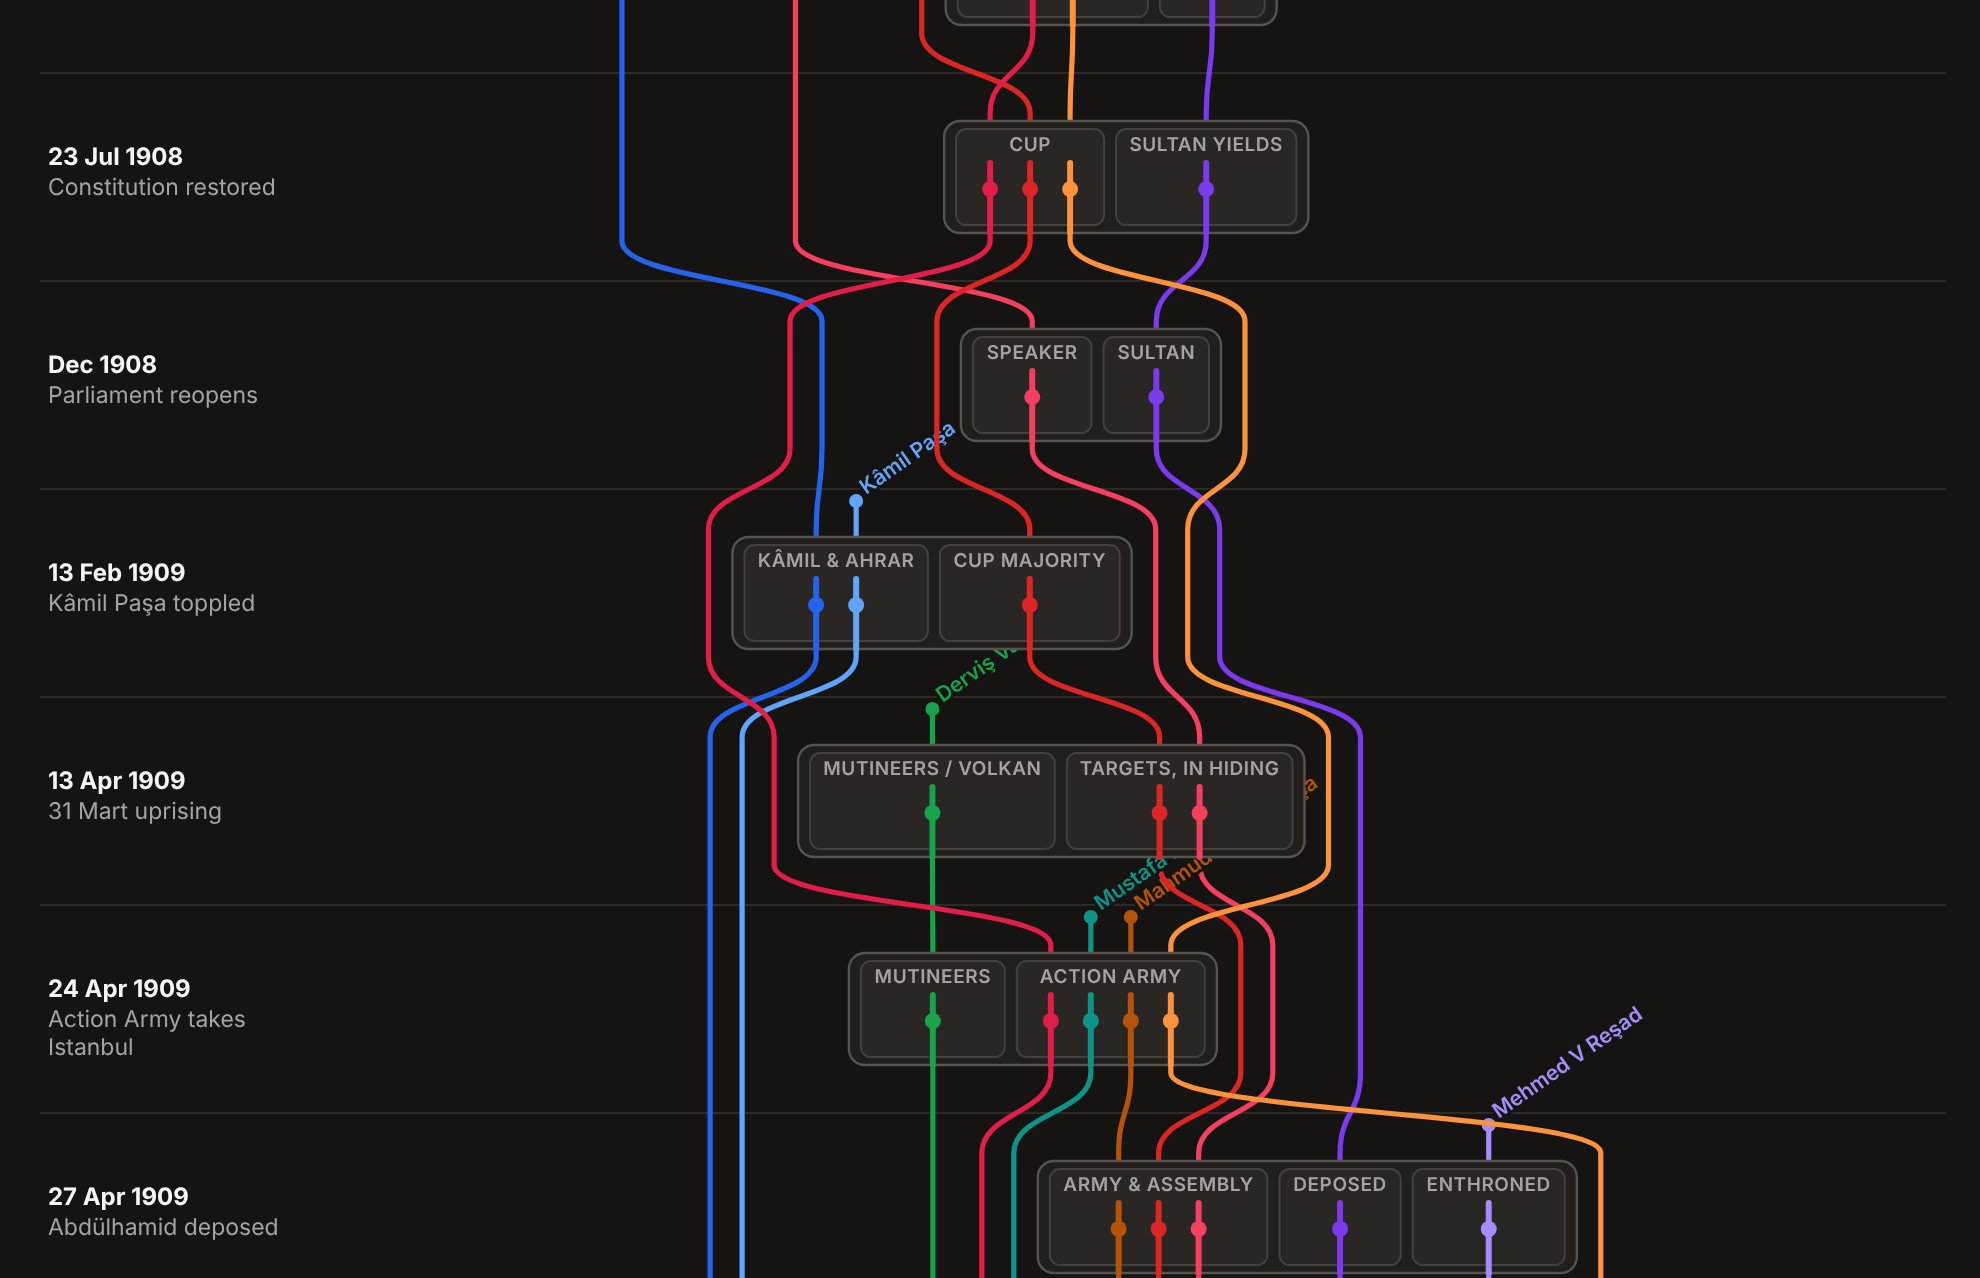
July 1908 to April 1909. Each event box is split into the parties involved.
What surprised me
How often it was the same people. The man who goes to the mountains in 1908 marches on Istanbul in 1909, storms the Sublime Porte in 1913 and runs the war in 1914. The officer posted to Sofia in 1913 is the one landing at Samsun in 1919. The opposition of 1912 is the government that loses the Balkan War, and the man behind the 1876 constitution is later tried for the death of the sultan he helped depose.
I had learned all of these events separately. Seeing who was who, and what they did, laid out in one picture made them much easier to follow than any list of dates.
How it is drawn
It is a single HTML file with no build step. This kind of chart is a storyline visualization, first drawn by hand in xkcd’s Movie Narrative Charts, and it turns into spaghetti fast. The layout follows the two steps of StoryFlow (Liu et al., 2013):
- Order the lines in each event to minimize crossings, with the barycenter heuristic from layered graph drawing.
- Straighten them: move each line sideways as little as possible while keeping gaps and staying out of boxes it isn’t part of, solved per event with isotonic regression. Lines that aren’t in an event don’t move at all.
Try it here: rical-1876.vercel.app.